Build notes
Behind the Build
How the scroll-scrubbed stellar lifecycle on the home page actually works: one engine, nine shaders, and the budgets that keep it fast enough to ship.
Architecture — one engine, one number
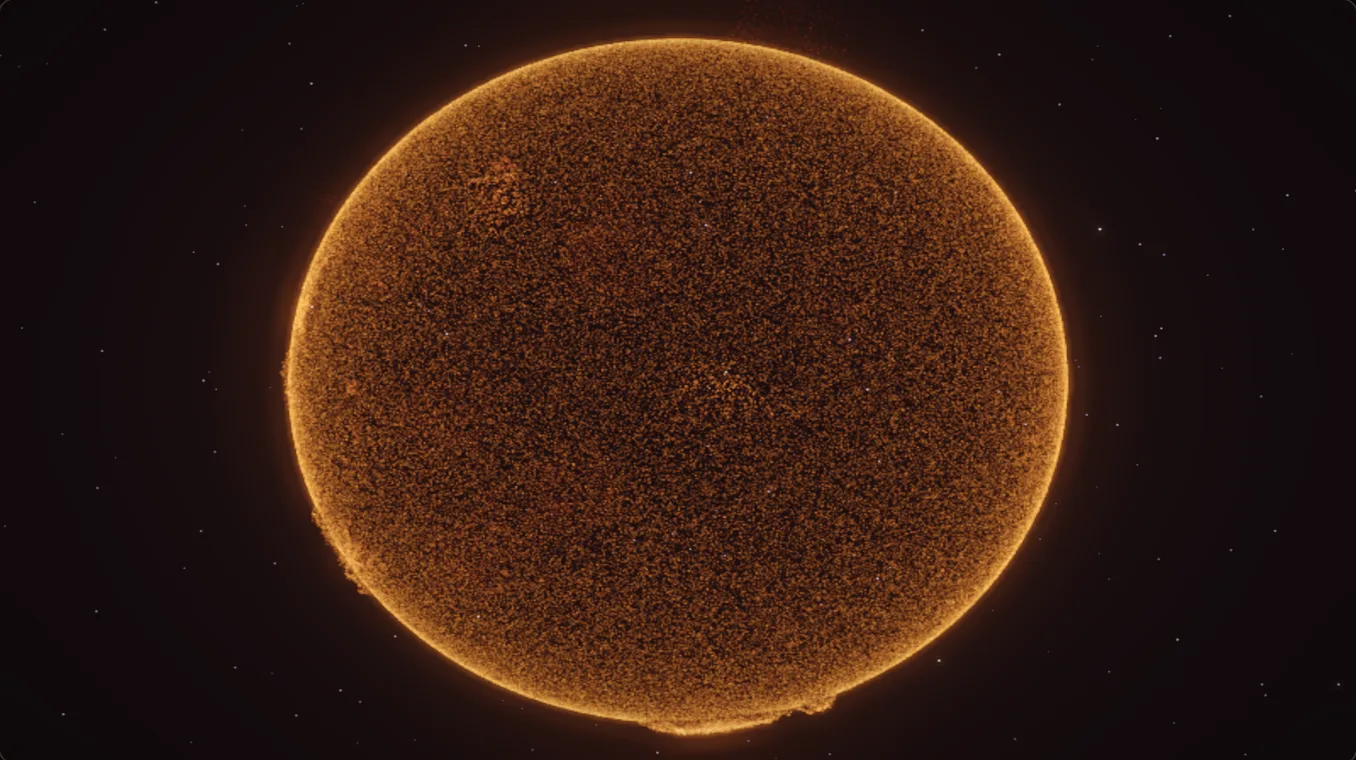
Every visible piece of the hero — the cloud, the shadow, the photon ring,
the supernova flash, the yellow star, the nebula, the lonely pale-blue dot —
is rendered by a single instance of createScene (see
src/hero/scene/createScene.ts). That engine takes one input
each frame: a number called getStage, somewhere in
[0, 3.5]. Everything downstream is a pure function of that
number.
Where the number comes from is the only thing the rest of the codebase has
to know. On the home page it is the scroll position routed through the
band-walker in sceneTable.ts. On an article like this one it
is the article scroll mapped into an authored window
(journey). On an inline figure it is pinned to a constant. The
engine cannot tell the difference, and there is exactly one engine to
debug.
The walker logic lives in src/hero/sceneTable.ts as a flat
SEGMENTS table. Each row is a timed span with a relative
weight, start/end stage values, and an easing function. The prefix-sum of
the weights reproduces the original breakpoints exactly. Adding a beat
means adding a row; the engine never changes.
Live shader gallery
Nine GLSL programs from src/hero/shaders/. Each panel below pins
the engine to the stage that best showcases the shader, with the actual
source toggleable underneath. The canvases are independent
createScene instances mounted on intersection — the engine
chunk only downloads when the figure scrolls into view.
lens
A shared point-lens function reused by the disk, the warp arcs, and the starfield. Bends every clip-space vertex around the black-hole image plane and returns both the deflected position and a magnification scalar.
View GLSL
  uniform float uThetaE;
  uniform float uShadowR;
  uniform float uAspect;
  uniform float uImageSign;

  vec4 lensClip(vec4 clipP, vec4 clipBH, out float mag, out float screenR){
    vec2 ndcP  = clipP.xy  / clipP.w;
    vec2 ndcBH = clipBH.xy / clipBH.w;
    vec2 off   = ndcP - ndcBH;
    vec2 aoff  = vec2(off.x * uAspect, off.y);
    float beta = max(length(aoff), 1e-4);
    vec2  dir  = aoff / beta;

    float u = beta / uThetaE;
    float root = sqrt(u*u + 4.0);
    float img = (uImageSign > 0.0) ? 0.5*(u + root) : 0.5*(u - root);
    float theta = img * uThetaE;

    float core = (u*u + 2.0) / (2.0 * u * root);
    mag = (uImageSign > 0.0) ? abs(core + 0.5) : abs(core - 0.5);

    vec2 newA = dir * theta;
    vec2 newOff = vec2(newA.x / uAspect, newA.y);
    vec2 newNdc = ndcBH + newOff;

    screenR = abs(theta);
    return vec4(newNdc * clipP.w, clipP.z, clipP.w);
  }
ring
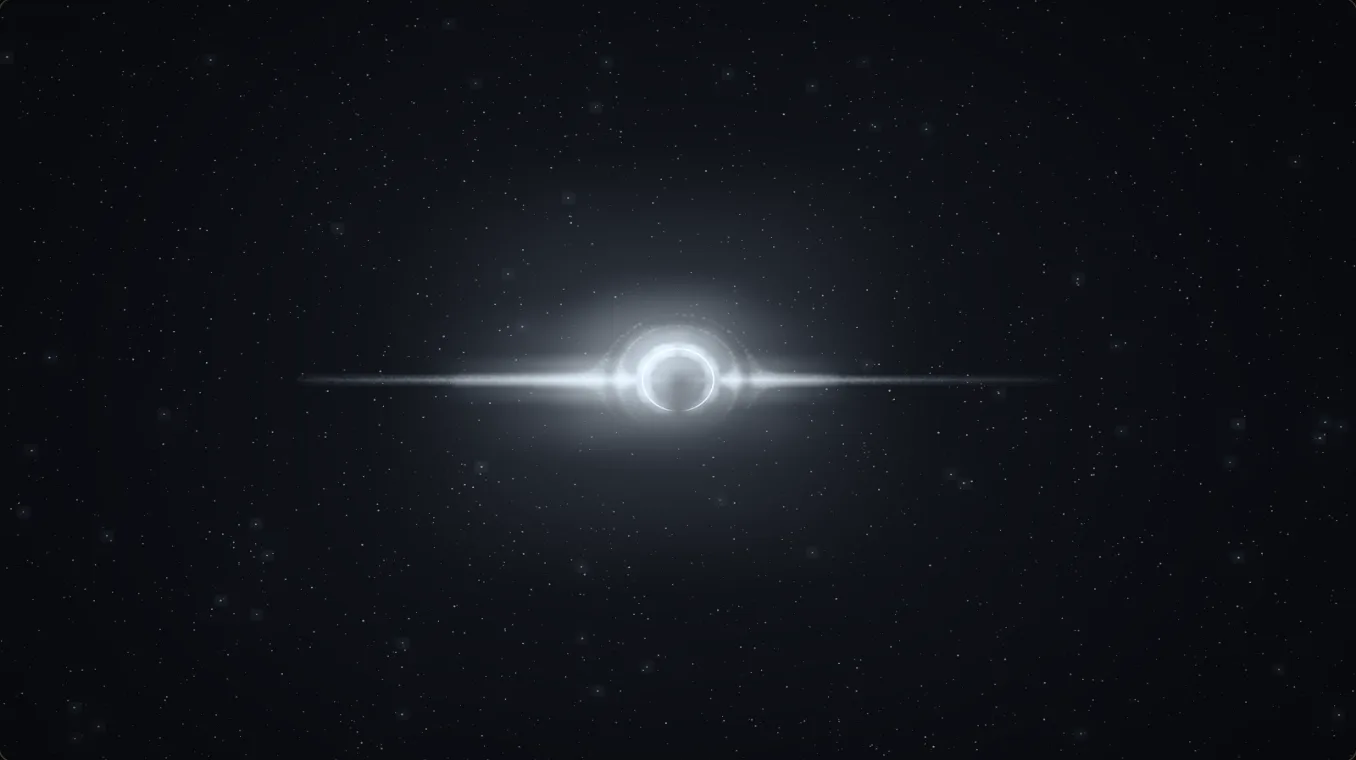
The thin cold-silver rim around the shadow. Brightness and band-width are coupled to the morph uniform so the ring tightens and dims as the hole shrinks toward the seed.
View GLSL
// --- vertex ---

  attribute float aAng; attribute float aSeed;
  uniform float uTime, uPixelRatio, uShadowR, uAspect, uHole, uVertAsym, uHorizAsym, uRingBright, uMorph;
  uniform float uRingScale;
  varying float vB;
  void main(){
    vec4 bhC = projectionMatrix * modelViewMatrix * vec4(0.0,0.0,0.0,1.0);
    vec2 ndcBH = bhC.xy / bhC.w;
    // SIZE-COUPLED RING. The photon ring is BRIGHTEST at the hero (uMorph≈0),
    // where the black hole is largest, and dims as the hole shrinks toward the
    // seed during the morph — the rim of light reads as a property of the hole's
    // size. It is fully gone before the shadow collapses to the seed/flash so the
    // remnant isn't haloed. bloom is the master 1->0 envelope.
    float bloom = 1.0 - smoothstep(0.10, 0.42, uMorph); // full at the hero, gone before the seed
    // As the ring dims it also tightens onto the rim and slims its band, so the
    // fade reads as the rim collapsing to a finer hairline, not just dropping out.
    float tighten = mix(1.0, 0.94, bloom);         // a touch tighter as it dims (bloom→0)
    float spread  = mix(0.012, 0.03, bloom);       // thinner radial band as it dims
    // uRingScale (dev): radius of the ring relative to the dark-core rim.
    float r = uHole * uRingScale * tighten * (1.0 + (aSeed-0.5)*spread);  // thin ring at the dark-core rim
    vec2 dir = vec2(cos(aAng), sin(aAng));
    vec2 ndc = ndcBH + vec2(dir.x * r / uAspect, dir.y * r);
    gl_Position = vec4(ndc, 0.0, 1.0);
    float tw = 0.78 + 0.22*sin(uTime*1.4 + aSeed*53.0);
    // complete, crisp circle in front of the stars: high floor, approaching side a touch brighter
    float dop = 0.85 + 0.40*smoothstep(0.55, -0.7, dir.x + 0.22*dir.y);
    // Baseline ~50% dimmer than before (a subtle rim, never a blazing halo).
    vB = tw * dop * (0.6 + 0.4*aSeed) * 1.45 * uRingBright * 0.5;
    // adjustable top/bottom and left/right asymmetries
    vB *= clamp(1.0 + uVertAsym * dir.y, 0.0, 3.0);
    vB *= clamp(1.0 - uHorizAsym * dir.x, 0.0, 3.0);
    // Gate by the size-coupled envelope: full at the hero, fading as the hole
    // shrinks, then gone before the shadow collapses.
    vB *= bloom;
    gl_PointSize = uPixelRatio * (0.7 + 0.8*aSeed);
  }

// --- fragment ---

  precision highp float; varying float vB;
  void main(){
    vec2 c = gl_PointCoord-0.5; float d=length(c); if(d>0.5) discard;
    float a = smoothstep(0.5, 0.0, d);
    // ITEM 2: the photon ring is a COLD silver / blue-white hairline (was warm 0.97,0.97,0.96),
    // so the rim of light reads cold-silver, never a warm halo.
    gl_FragColor = vec4(vec3(0.90,0.94,1.00) * vB * a * 1.0, 1.0);
  }
warp
Light bent into short arcs in a narrow band around the Einstein radius. Uses the same lens math as the starfield but draws arcs instead of points, so the bent-light caustics stay legible.
View GLSL
// --- vertex ---

  attribute float aSeed; attribute float aS;     // aS ∈ [-1,1] along the arc
  uniform float uTime, uShadowR, uThetaE, uAspect, uImageSign, uWarp, uHole;
  varying float vB; varying float vAbs;
  void main(){
    vec4 clip = projectionMatrix * modelViewMatrix * vec4(position,1.0);
    vec4 bhC  = projectionMatrix * modelViewMatrix * vec4(0.0,0.0,0.0,1.0);
    bool drop = (clip.w <= 0.0);
    vec2 ndc   = clip.xy / max(clip.w,1e-4);
    vec2 ndcBH = bhC.xy  / max(bhC.w,1e-4);
    vec2 off = ndc - ndcBH; vec2 a = vec2(off.x*uAspect, off.y);
    float beta = max(length(a), 2e-4); vec2 dir = a/beta;

    // point-lens deflection (same formulae as the starfield)
    float root = sqrt(beta*beta + 4.0*uThetaE*uThetaE);
    float thetaImg = (uImageSign>0.0) ? 0.5*(beta+root) : 0.5*(beta-root);
    float u = beta/uThetaE;
    float magCore = (u*u+2.0)/(u*sqrt(u*u+4.0));
    float mag = (uImageSign>0.0) ? abs(0.5*(magCore+1.0)) : abs(0.5*(magCore-1.0));

    vec2 aImg = dir * thetaImg;                  // image position (may be opposite)
    float rNew = length(aImg);
    vec2 idir = aImg / max(rNew, 1e-5);          // radial direction of the IMAGE
    float phi0 = atan(idir.y, idir.x);

    // tangential magnification μ_t = θ/β
    float tang = rNew / beta;
    // lensed stretch: ONLY in a thin band near the ring (no orbit).
    // Beyond that, stars stay point-like -> it's the DENSITY that deforms.
    float prox = smoothstep(uThetaE*1.4, uThetaE*1.03, rNew);
    float dPhi = min(prox * 0.30 * clamp(tang-1.0, 0.0, 6.0) * uWarp, 0.20); // very short half-width (rad)
    float phi = phi0 + aS * dPhi;                // arc along the circle of radius rNew
    vec2 aP = rNew * vec2(cos(phi), sin(phi));
    vec2 ndcNew = ndcBH + vec2(aP.x/uAspect, aP.y);

    if(rNew < uHole) drop = true;
    if(uImageSign<0.0 && rNew > uThetaE*1.35) drop = true; // 2nd image confined near the ring

    gl_Position = vec4(ndcNew, 0.0, 1.0);
    float tw = 0.65 + 0.35*sin(uTime*0.7 + aSeed*40.0);
    float caustic = smoothstep(uThetaE*0.05, uThetaE*0.6, beta); // avoid near-aligned arcs being too bright
    vB = (0.2 + 0.8*aSeed) * tw * (0.3 + 0.7*prox) * clamp(mag, 0.4, 1.8) * mix(0.3, 1.0, caustic);
    if(uImageSign<0.0) vB *= 0.7;
    if(drop) vB = 0.0;
    vAbs = abs(aS);                              // 0 at the arc centre -> 1 at the ends
  }

// --- fragment ---

  precision highp float; varying float vB; varying float vAbs;
  void main(){
    float fade = smoothstep(1.0, 0.05, vAbs);    // bright at centre, fades at the ends
    // ITEM 2: the lensed warp arcs read COLD silver / faint blue-white (eased a touch
    // cooler) so the bent light around the shadow stays in the cold black-hole palette.
    gl_FragColor = vec4(vec3(0.90,0.94,1.00) * vB * fade * 0.9, 1.0);
  }
star
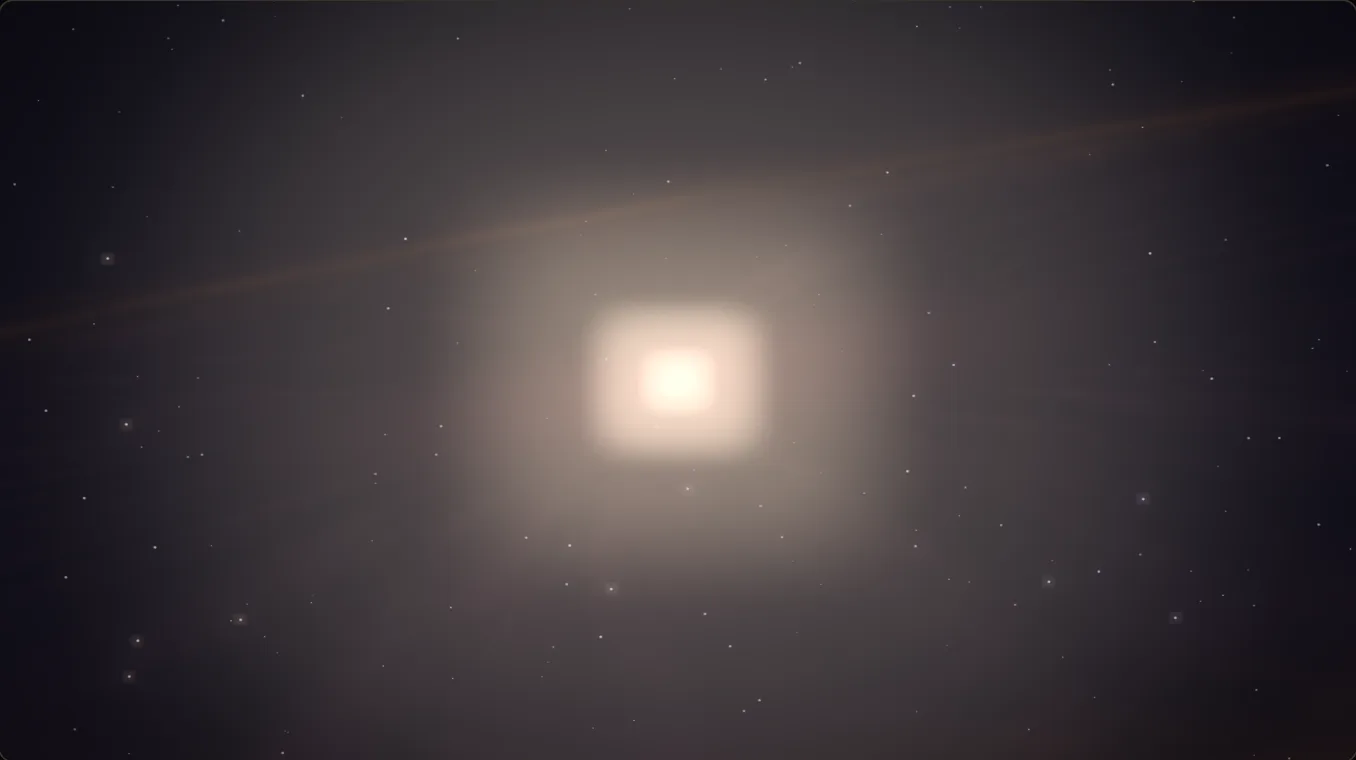
A 3D dome of points pushed through the same lens function. Each star carries a primary image plus an opposite-side secondary, so the lensing produces the characteristic Einstein ring as the hole crosses the field.
View GLSL — first 80 of 163 lines
Full source (163 lines) on GitHub
  attribute float aSeed;
  uniform float uTime, uPixelRatio, uShadowR, uThetaE, uAspect, uImageSign, uStarBright, uHole, uRotSpeed, uSizeScale;
  varying float vB;
  varying float vSizeComp;
  varying vec3 vTint;   // per-star colour family (warm-graphite / near-white / cool accent)

  // small hash so each star rolls an independent family without a new attribute.
  float starHash(float n){ return fract(sin(n*78.233)*43758.5453); }

  void main(){
    vSizeComp = 1.0;
    // --- STAR COLOUR FAMILIES -------------------------------------------------
    // Not one uniform tint (that reads dusty); a weighted palette so the field has
    // depth. Majority warm-graphite/bone to sit with the warm grade, a slice of
    // crisp near-white for the bright points, and a RARE cool accent so the scene
    // never goes fully beige. Brighter stars (high aSeed) bias toward near-white,
    // faint ones toward bone — bright = crisp, faint = warm (the reference look).
    // ITEM 2: cool the star families toward COLD silver so the black-hole field reads
    // cold + near-monochrome (the warm-bone majority was what made the opening read as a
    // warm space scene). The 'warmGraphite' family is renamed in spirit to a cold silver
    // (blue lifted above red), the near-white pushed faintly blue, the cool accent kept.
    float fam = starHash(aSeed*131.71 + 4.0);             // family roll 0..1
    vec3 warmGraphite = mix(vec3(0.42,0.45,0.50),         // faint cold silver
                            vec3(0.62,0.67,0.74), aSeed); // brighter cold silver
    vec3 nearWhite    = vec3(0.92,0.95,0.99);             // crisp, faintly blue-white
    vec3 coolAccent   = vec3(0.70,0.78,0.94);             // faint cobalt depth
    float roll = clamp(fam*0.78 + aSeed*0.22, 0.0, 1.0);  // bright points bias white
    vec3 tint = warmGraphite;
    tint = mix(tint, nearWhite,  step(0.74, roll));       // ~18% near-white (the bright)
    tint = mix(tint, coolAccent, step(0.92, roll));       // ~8% cool accent (rare depth)
    vTint = tint;

    // --- SLOW ORBIT AROUND THE HOLE -------------------------------------------
    // Spin the star's world position around the same ~23°-tilted pole the
    // photosphere uses BEFORE projection, so the existing per-vertex screen-space
    // lensing math below bends a MOVING field for free (the warp visibly acts on
    // orbiting stars, not a static backdrop). The hole sits at the world origin,
    // which is invariant under this rotation, so bhC stays put.
    float orbAng = uTime * uRotSpeed;
    vec3  orbAxis = normalize(vec3(sin(0.401), cos(0.401), 0.0)); // 0.401 rad ≈ 23° off world-Y
    float orbC = cos(orbAng);
    float orbS = sin(orbAng);
    // Rodrigues' rotation of position about orbAxis.
    vec3 orbPos = position * orbC
                + cross(orbAxis, position) * orbS
                + orbAxis * dot(orbAxis, position) * (1.0 - orbC);

    vec4 clip = projectionMatrix * modelViewMatrix * vec4(orbPos,1.0);
    vec4 bhC  = projectionMatrix * modelViewMatrix * vec4(0.0,0.0,0.0,1.0);
    bool drop = (clip.w <= 0.0);
    vec2 ndc   = clip.xy / max(clip.w, 1e-4);
    vec2 ndcBH = bhC.xy / max(bhC.w, 1e-4);
    vec2 off = ndc - ndcBH;
    vec2 a   = vec2(off.x*uAspect, off.y);
    float beta = max(length(a), 2e-4);
    vec2 dir = a / beta;

    float root = sqrt(beta*beta + 4.0*uThetaE*uThetaE);
    float thetaImg = (uImageSign > 0.0) ? 0.5*(beta + root) : 0.5*(beta - root);
    float u = beta / uThetaE;
    float magCore = (u*u + 2.0) / (u*sqrt(u*u + 4.0));
    float mag = (uImageSign > 0.0) ? abs(0.5*(magCore + 1.0)) : abs(0.5*(magCore - 1.0));

    vec2 aNew   = dir * thetaImg;
    vec2 offNew = vec2(aNew.x/uAspect, aNew.y);
    vec2 ndcNew = ndcBH + offNew;
    float rNew  = length(aNew);

    if(rNew < uHole) drop = true;
    if(uImageSign < 0.0 && rNew > uThetaE*1.25) drop = true;

    gl_Position = vec4(ndcNew, 0.0, 1.0);
    float tw = 0.55 + 0.45*sin(uTime*0.7 + aSeed*40.0);
    // The photon over-density at the rim comes from the COMPRESSION of positions
    // near the ring (points pile up), not from a brightness factor that saturates
    // to a hot point. So we keep brightness near-flat.
    float mg = clamp(mag, 0.5, 1.2);
    float caustic = smoothstep(uThetaE*0.04, uThetaE*0.75, beta); // damp very near alignment
    vB = (0.30 + 0.70*aSeed) * tw * mg * uStarBright * mix(0.5, 1.0, caustic);
streak
A radial line-streak rig with two opacity tiers: a few strong structural rays carrying signal and a soft field of faint lanes that recede. Active only in the dive / hyperspace beat.
View GLSL
// --- vertex ---

  attribute float aSeed;
  attribute float aEnd;
  attribute float aStrong;   // 1 = strong structural ray, 0 = faint lane (ITEM 6 two-tier)
  uniform float uTime, uPixelRatio, uAspect, uStreak, uStreakDir;
  varying float vA;
  varying float vStrong;

  void main(){
    vec4 clip = projectionMatrix * modelViewMatrix * vec4(position, 1.0);
    vec2 ndc = clip.xy / max(clip.w, 1e-4);
    float rad = length(vec2(ndc.x * uAspect, ndc.y));
    vec2 dir = rad > 1e-4 ? normalize(ndc) : vec2(1.0, 0.0);
    float lane = 0.38 + 0.72 * aSeed;
    float drift = fract(uTime * 0.18 + aSeed) * 0.08 * uStreakDir;
    float stretch = uStreak * lane * (0.72 + 1.18 * rad);
    ndc += dir * aEnd * (stretch + drift);
    gl_Position = vec4(ndc * clip.w, clip.z, clip.w);
    gl_PointSize = uPixelRatio;
    // ITEM 6: TWO opacity tiers so the far/faint lanes recede and only the few strong
    // structural rays carry signal — precision/clarity, not a wireframe explosion. The
    // faint tier peaks at ~0.18 alpha, the strong tier at ~0.38 (matching the spec's
    // rgba(160,185,255,.18) / rgba(210,225,255,.38)). The radial fade (mix on aEnd) keeps
    // the FAR end of every lane more transparent.
    float tierA = mix(0.18, 0.38, aStrong);
    vA = uStreak * tierA * mix(1.0, 0.42, aEnd);
    vStrong = aStrong;
  }

// --- fragment ---

  precision highp float;
  varying float vA;
  varying float vStrong;

  void main(){
    // ITEM 6: faint lanes read rgba(160,185,255) (cool blue), strong rays the brighter
    // rgba(210,225,255) blue-white — so the few structural rays stand out from the field.
    vec3 faint  = vec3(0.63, 0.73, 1.0);
    vec3 strong = vec3(0.82, 0.88, 1.0);
    vec3 col = mix(faint, strong, vStrong);
    gl_FragColor = vec4(col * vA, vA);
  }
disk
The cloud that morphs from Keplerian-orbit disk to nebula. Per-point vertex morph drives the position; relativistic beaming, gravitational redshift, and a T ∝ r^-3/4 colour ramp drive the fragment. The dominant draw cost on the page.
View GLSL — first 110 of 2049 lines
Full source (2049 lines) on GitHub
  // --- CLICK ERUPTIONS on the particle red giant (geyser jet + surface ripple) ---
  // N_ERUPT must equal DISK_ERUPT_SLOTS (and matches the mesh's N_ERUPT). ERUPT_LIFE
  // is the total lifetime of one eruption in seconds — the jet rises+falls and the
  // ripple expands+fades over this span; the render loop frees the slot at the same
  // age. Both values are byte-identical to the yellow-star mesh (sun.glsl.ts) so the
  // two bodies erupt with the same timing/feel.
  #define N_ERUPT 4
  #define ERUPT_LIFE 2.4
  // GIANT_ERUPT_LIFE: the PARTICLE red giant's geyser runs on its OWN, much longer
  // clock than the shared 2.4 (which still governs the yellow-star MESH). The user
  // wants the giant plume to "feel the gravity" — a slow ballistic loft, a long hang
  // near the apex, then an accelerating fall — so the whole event is stretched to
  // ~2.3× the old life (5.5s vs 2.4s). MUST stay numerically identical to the JS
  // GIANT_ERUPT_LIFE in createScene.ts: the render loop frees the giant slot (and
  // wraps the debug clock) at this same age, so if the two drift the slot would die
  // (intensity→0) BEFORE the shader finished animating and the plume would vanish
  // mid-flight. The yellow-star MESH keeps ERUPT_LIFE=2.4 — untouched by this.
  #define GIANT_ERUPT_LIFE 5.5
  attribute float aU;
  attribute float aPhase;
  attribute float aThickN;
  attribute float aSeed;
  // per-particle texel UV into the GPGPU sim position texture (nebula↔star window)
  attribute vec2 aSimUV;

  uniform float uTime, uOmega0, uSpinDir, uBetaScale, uBeamExp, uDoppler;
  uniform float uRin, uRout, uThick, uPixelRatio, uSec, uHole, uVertAsym, uHorizAsym, uDistrib;
  uniform float uBright;
  // Low-tier grain-SIZE multiplier (1.0 = high/desktop-full → byte-identical; >1.0
  // ONLY when the JS built the rig with the reduced low-tier grain budget). Fattens
  // every grain so the thinned, un-bloomed low-tier cloud overlaps back into
  // continuous gas instead of scattered dots. Folded into baseSize below so it reaches
  // every point-size branch, and into the per-branch clamp ceilings so it isn't capped.
  uniform float uPointGain;
  // Runtime density-by-banishment: the retained seed fraction. 1.0 retains the
  // whole construction-time buffer; lower values clip a deterministic subset
  // before rasterisation, with no buffer resize, draw-call change or recompilation.
  uniform float uVisibleRatio;
  uniform float uVisibleBrightGain;
  // Black-hole-only geometric shrink (1 = full disk, →small as the hole implodes).
  // Gated to uGiant==0 in the body so the red giant and later states are untouched.
  uniform float uBlackHoleScale;
  // Half-res particle pass (buildParticlePass): the ratio of the offscreen target's
  // resolution to the composer's (1.0 = the original full-res single pass, exact
  // no-op). gl_PointSize is in RENDER-TARGET pixels, so on a scaled-down target the
  // same size would cover 1/uSizeScale× the intended SCREEN footprint (≈4× the
  // energy at 0.5 after the bilinear upsample). The block at the end of main()
  // rescales the final point size — and, for sprites that hit the 1px raster floor,
  // conserves their total added light via vSizeComp (the fragment folds it into the
  // final intensity), so the composited half-res field carries the SAME energy the
  // full-res raster would have produced, just resolved on a coarser grid.
  uniform float uSizeScale;
  varying float vSizeComp;
  // secondary-image (lower band) screen-space nudge — used to close the seam
  uniform float uSecOffsetX, uSecOffsetY;
  // --- Transition 1: reverse supernova (driven by scroll). 0 = black hole.
  //   uMorph ∈ [0,1]: implosion (0→0.45), flash (~0.5), flare-out (0.55→1).
  //   uFlash is a precomputed 0..1 burst envelope peaking at the flash.
  //   uCollapse ∈ [0,1]: the red-giant SURFACE collapse. 0 = full red-giant
  //     sphere; 1 = the surface has shrunk to the point (the flash/seed). The
  //     non-homogeneous shrink of the sphere IS the explosion — laggard regions
  //     of the surface stick out as the finger-spikes (see the giant block). ---
  uniform float uMorph, uFlash, uCollapse;


  uniform float uThetaE;
  uniform float uShadowR;
  uniform float uAspect;
  uniform float uImageSign;

  vec4 lensClip(vec4 clipP, vec4 clipBH, out float mag, out float screenR){
    vec2 ndcP  = clipP.xy  / clipP.w;
    vec2 ndcBH = clipBH.xy / clipBH.w;
    vec2 off   = ndcP - ndcBH;
    vec2 aoff  = vec2(off.x * uAspect, off.y);
    float beta = max(length(aoff), 1e-4);
    vec2  dir  = aoff / beta;

    float u = beta / uThetaE;
    float root = sqrt(u*u + 4.0);
    float img = (uImageSign > 0.0) ? 0.5*(u + root) : 0.5*(u - root);
    float theta = img * uThetaE;

    float core = (u*u + 2.0) / (2.0 * u * root);
    mag = (uImageSign > 0.0) ? abs(core + 0.5) : abs(core - 0.5);

    vec2 newA = dir * theta;
    vec2 newOff = vec2(newA.x / uAspect, newA.y);
    vec2 newNdc = ndcBH + newOff;

    screenR = abs(theta);
    return vec4(newNdc * clipP.w, clipP.z, clipP.w);
  }


  // cheap value-noise hash for the turbulent flare displacement
  float h31(vec3 p){ p = fract(p*0.3183099 + 0.1); p *= 17.0; return fract(p.x*p.y*p.z*(p.x+p.y+p.z)); }
  // smooth 3D value noise (for the red-giant granulation / convection)
  float vnoise(vec3 p){
    vec3 i = floor(p), f = fract(p);
    f = f*f*(3.0-2.0*f);
    float n000=h31(i+vec3(0,0,0)), n100=h31(i+vec3(1,0,0));
    float n010=h31(i+vec3(0,1,0)), n110=h31(i+vec3(1,1,0));
    float n001=h31(i+vec3(0,0,1)), n101=h31(i+vec3(1,0,1));
    float n011=h31(i+vec3(0,1,1)), n111=h31(i+vec3(1,1,1));
    return mix(mix(mix(n000,n100,f.x),mix(n010,n110,f.x),f.y),
               mix(mix(n001,n101,f.x),mix(n011,n111,f.x),f.y), f.z);
  }
sun
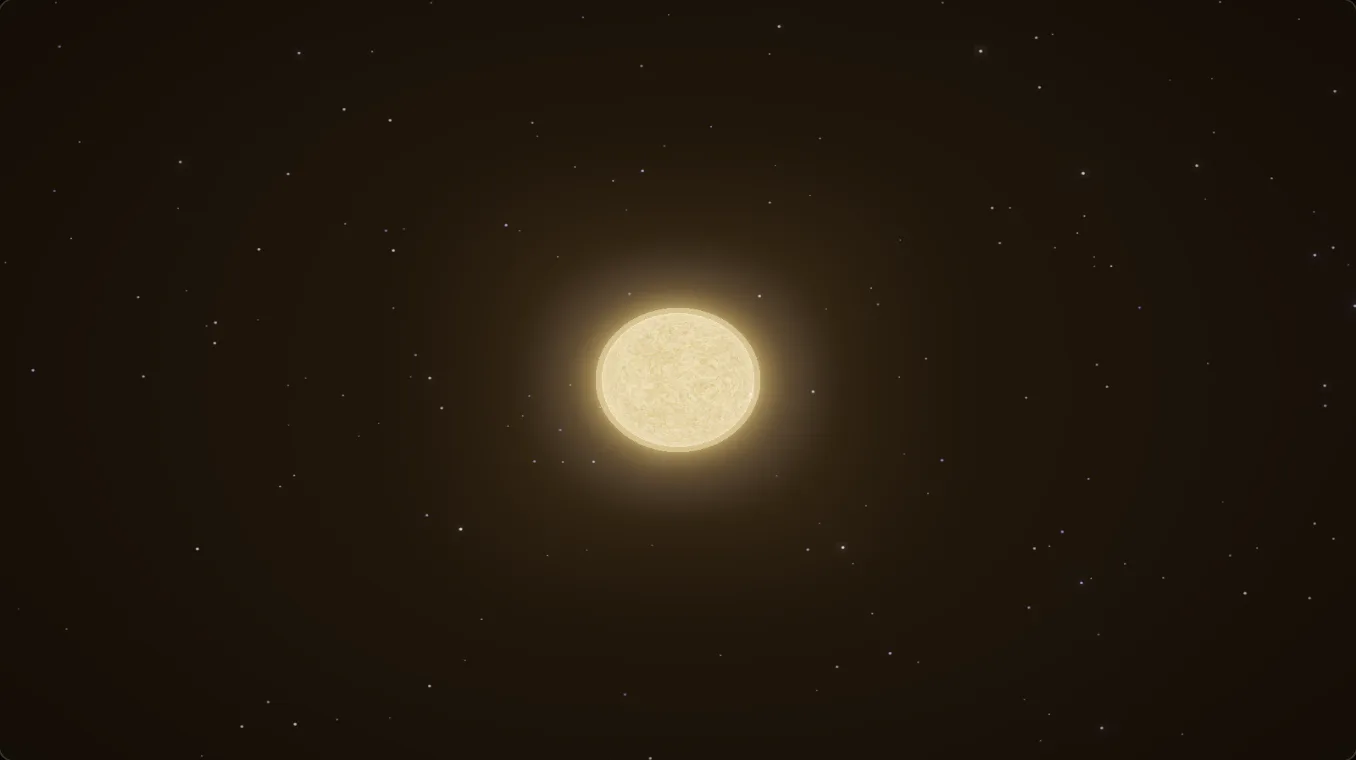
The dedicated yellow-star mesh rig: a tilted photosphere with noise-driven granulation, a corona, an outer glow, and four addressable eruption slots driven from the same getStage value.
View GLSL — first 90 of 565 lines
Full source (565 lines) on GitHub
vec3 mod289(vec3 x){return x - floor(x*(1.0/289.0))*289.0;}
vec4 mod289(vec4 x){return x - floor(x*(1.0/289.0))*289.0;}
vec4 permute(vec4 x){return mod289(((x*34.0)+1.0)*x);}
vec4 taylorInvSqrt(vec4 r){return 1.79284291400159 - 0.85373472095314*r;}
float snoise(vec3 v){
  const vec2 C = vec2(1.0/6.0, 1.0/3.0);
  const vec4 D = vec4(0.0, 0.5, 1.0, 2.0);
  vec3 i  = floor(v + dot(v, C.yyy));
  vec3 x0 = v - i + dot(i, C.xxx);
  vec3 g = step(x0.yzx, x0.xyz);
  vec3 l = 1.0 - g;
  vec3 i1 = min(g.xyz, l.zxy);
  vec3 i2 = max(g.xyz, l.zxy);
  vec3 x1 = x0 - i1 + C.xxx;
  vec3 x2 = x0 - i2 + C.yyy;
  vec3 x3 = x0 - D.yyy;
  i = mod289(i);
  vec4 p = permute( permute( permute(
            i.z + vec4(0.0, i1.z, i2.z, 1.0))
          + i.y + vec4(0.0, i1.y, i2.y, 1.0))
          + i.x + vec4(0.0, i1.x, i2.x, 1.0));
  float n_ = 0.142857142857;
  vec3 ns = n_ * D.wyz - D.xzx;
  vec4 j = p - 49.0 * floor(p * ns.z * ns.z);
  vec4 x_ = floor(j * ns.z);
  vec4 y_ = floor(j - 7.0 * x_);
  vec4 x = x_ * ns.x + ns.yyyy;
  vec4 y = y_ * ns.x + ns.yyyy;
  vec4 h = 1.0 - abs(x) - abs(y);
  vec4 b0 = vec4(x.xy, y.xy);
  vec4 b1 = vec4(x.zw, y.zw);
  vec4 s0 = floor(b0)*2.0 + 1.0;
  vec4 s1 = floor(b1)*2.0 + 1.0;
  vec4 sh = -step(h, vec4(0.0));
  vec4 a0 = b0.xzyw + s0.xzyw*sh.xxyy;
  vec4 a1 = b1.xzyw + s1.xzyw*sh.zzww;
  vec3 p0 = vec3(a0.xy, h.x);
  vec3 p1 = vec3(a0.zw, h.y);
  vec3 p2 = vec3(a1.xy, h.z);
  vec3 p3 = vec3(a1.zw, h.w);
  vec4 norm = taylorInvSqrt(vec4(dot(p0,p0), dot(p1,p1), dot(p2,p2), dot(p3,p3)));
  p0 *= norm.x; p1 *= norm.y; p2 *= norm.z; p3 *= norm.w;
  vec4 m = max(0.6 - vec4(dot(x0,x0), dot(x1,x1), dot(x2,x2), dot(x3,x3)), 0.0);
  m = m*m;
  return 42.0 * dot(m*m, vec4(dot(p0,x0), dot(p1,x1), dot(p2,x2), dot(p3,x3)));
}
float fbm(vec3 p){
  float v = 0.0; float a = 0.5;
  for(int i=0;i<6;i++){ v += a*snoise(p); p*=2.02; a*=0.5; }
  return v;
}

  // returns vec3(m, ch, granMul) — mottle field, network field, granulation gain
  vec3 sunSurfaceField(vec3 sdir, float t, vec3 waveDisp){
    vec3 p = sdir * 2.4;
    vec3 q;
    q.x = fbm(p + vec3(0.0,0.0,t));
    q.y = fbm(p + vec3(5.2,1.3,2.7) + t);
    q.z = fbm(p + vec3(1.7,9.2,3.4) - t);
    float n = fbm(p + 3.2*q + waveDisp + t*0.5);
    float m = clamp(n*0.5+0.5, 0.0, 1.0);
    float ch = fbm(p*1.4 + 2.0*q.yzx + waveDisp*1.4 + t*0.3);
    float gran = fbm(p*7.0 + waveDisp*7.0 + t*1.0);
    float gran2 = fbm(p*15.0 + waveDisp*15.0 - t*0.6);
    float gran3 = fbm(p*28.0 + waveDisp*28.0 + t*0.4);
    float granMul = 0.90 + 0.50*(gran*0.5+0.5) + 0.10*(gran2*0.5+0.5) + 0.07*(gran3*0.5+0.5);
    return vec3(m, ch, granMul);
  }

  #define N_ERUPT 4
  // ERUPT_LIFE: total lifetime of one eruption in seconds. The plume + ripple both
  // fade out by here; the render loop frees the slot (intensity→0) at the same age.
  #define ERUPT_LIFE 2.4
  uniform float uTime;
  // uMeshFade ∈ [0,1]: the yellow-mesh CROSS-DISSOLVE opacity. 1 = fully present (the
  // normal opaque star); <1 ONLY during the tight yellow↔red swap band, where the mesh
  // fades IN over the dissolving gold cloud. Multiplies BOTH the emitted colour and the
  // output alpha so the opaque photosphere reads as a partially-transparent body that
  // dissolves cleanly over black (no hard on/off pop). Default 1 → no-op everywhere else.
  uniform float uMeshFade;
  // uRed ∈ [0,1]: 0 = yellow star (gold, bright), 1 = red giant (deep red, dim).
  // Drives the photosphere from a hot gold palette toward a cool, matte, deep-red
  // one and pulls overall brightness down — the COOLING half of the inflation.
  uniform float uRed;
  // uBlue ∈ [0,1]: 0 = settled yellow/gold star, 1 = HOT young blue-white star.
  // "Mass induces heat": while the star is still forming/small it is blue-white
  // hot; as it grows to full mass it cools to yellow. Driven by (1 - starFormed).
  uniform float uBlue;
  // uSeedGlow ≥ 1: NEWBORN-SEED emission lift. A freshly-forming star is rendered at
post
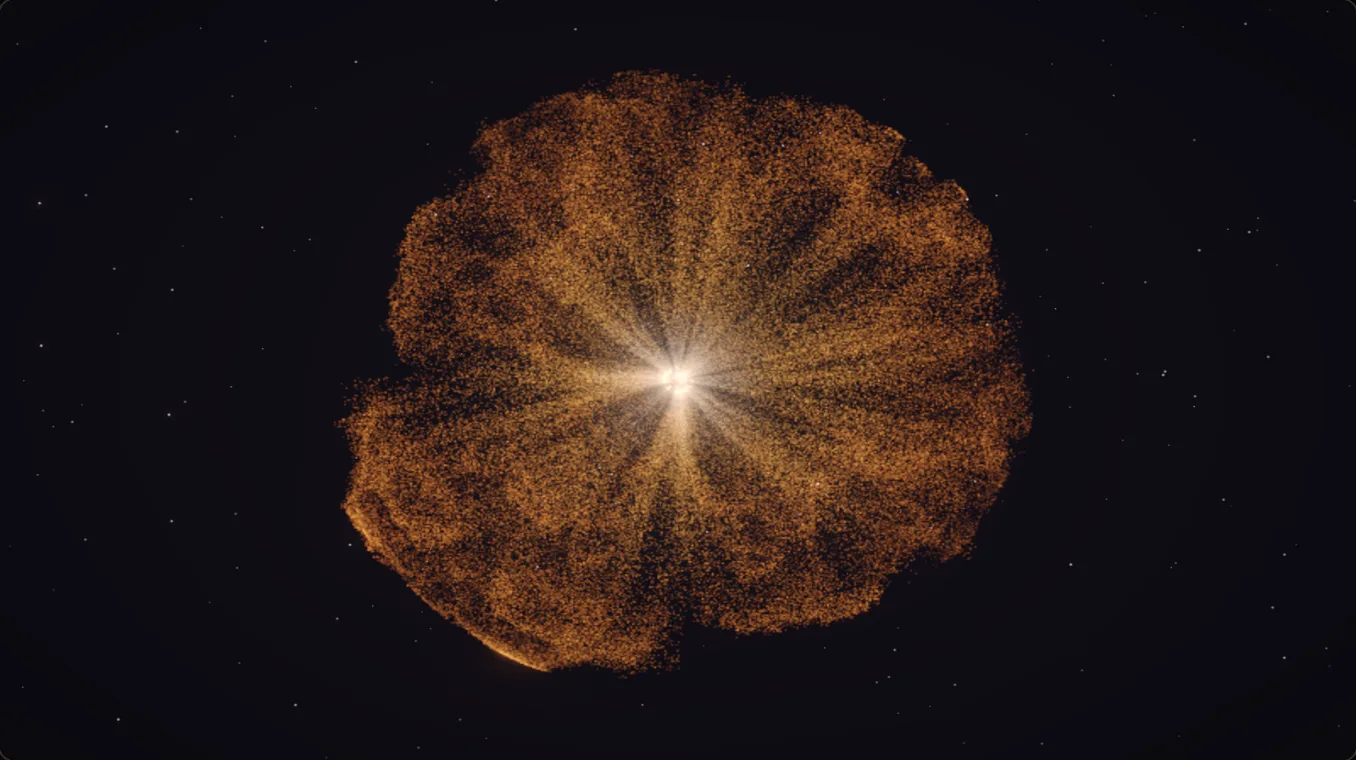
Two full-screen passes composited after the bloom: a filmic grade with state-tunable tone-map and shadow tint, and the supernova whiteout that fires on the morph breakout.
View GLSL
// --- grade (vertex) ---

    varying vec2 vUv;
    void main(){ vUv = uv; gl_Position = projectionMatrix * modelViewMatrix * vec4(position,1.0); }

// --- grade (fragment) ---

    precision highp float;
    uniform sampler2D tDiffuse;
    uniform float uTime, uExposure, uGrain, uWarmth, uSat, uOlive, uToneComp;
    uniform float uGrainAmt, uGrainSeed;
    uniform vec2 uResolution;
    varying vec2 vUv;
    float hash(vec2 p){ p=fract(p*vec2(123.34,456.21)); p+=dot(p,p+45.32); return fract(p.x*p.y); }
    void main(){
      vec3 col = texture2D(tDiffuse, vUv).rgb * uExposure;
      // soft tone map (preserves the white core). uToneComp is the compression
      // denominator — lower for the red giant so its deep red isn't crushed to black.
      col = col / (col + vec3(uToneComp));
      col = pow(col, vec3(0.92));
      // desaturate -> grey
      float luma = dot(col, vec3(0.299,0.587,0.114));
      col = mix(vec3(luma), col, uSat);
      // slight warm tint in the highlights
      col *= vec3(1.0 + uWarmth, 1.0, 1.0 - uWarmth*0.85);
      // COLD-SILVER tint of the background + halo falloff (ITEM 2). The black-hole
      // spec is cold: bg #030405, dust #11151A, accent #9EA8B8 — a near-monochrome
      // silver/black room, gravitational and EMPTY, with NO warm bone. uOlive (kept as
      // the uniform name for back-compat) now drives a COOL grade: BLUE sits highest
      // and red is pulled DOWN, so the shadows go cold silver-graphite, the eye-reset
      // opposite of the warm red/yellow chapters. This is gated per-state by look.olive
      // (≈0 in every later state, full only at the black hole), so the cold cast NEVER
      // warm- or cold-bleeds into the other chapters.
      float shW = 1.0 - smoothstep(0.0, 0.5, luma);          // weight in the shadows
      col *= mix(vec3(1.0), vec3(0.92, 0.97, 1.04), uOlive*shW);  // cool silver-blue shadow cast
      col += vec3(0.011, 0.013, 0.016) * uOlive;             // cold-graphite floor (faint blue-silver, #11151A family)
      col += vec3(0.004, 0.0045, 0.005);                     // slight cool-neutral floor
      // fine grain
      float g = hash(vUv*uResolution + fract(uTime)*97.0);
      col += (g-0.5)*uGrain;
      // LUMINANCE-ADAPTIVE film grain (uGrainAmt; 0 = off, term is exactly 0).
      // Purpose: let the particle-cloud density be lowered without the cloud
      // resolving into discrete dots ("confetti"). Signed hash noise (±0.5),
      // re-seeded per frame via uGrainSeed, weighted by a luminance curve that
      // PEAKS in the dark-to-mid range and fades to ~0 in highlights — it fills
      // the dim gaps BETWEEN sparse grains while leaving the bright disk/bloom
      // core clean. A small positive lift rides along in the near-black so gaps
      // read as textured gas rather than pure black holes between dots.
      // TEXTURE: vertically-correlated ("old-TV") noise — the hash is sampled at a
      // y-compressed coordinate (px.y / GRAIN_STRETCH, ~8px of vertical correlation)
      // so it forms subtle vertical streaks like analog CRT noise, blended 70/30
      // with plain per-pixel hash so it never reads as pure banding. Both layers
      // ride uGrainSeed so the streaks re-seed (shimmer) every frame.
      const float GRAIN_STRETCH = 8.0;                              // px of vertical correlation
      float fl = dot(col, vec3(0.299,0.587,0.114));                 // post-grade luma
      vec2 fpx = vUv*uResolution;
      vec2 fseed = vec2(fract(uGrainSeed)*113.0, fract(uGrainSeed*0.61)*57.0);
      float fgStreak = hash(vec2(fpx.x, floor(fpx.y / GRAIN_STRETCH)) + fseed) - 0.5; // vertical streaks
      float fgPixel  = hash(fpx + fseed) - 0.5;                     // per-pixel salt
      float fg = fgStreak*0.7 + fgPixel*0.3;                        // signed ±
      float fw = smoothstep(0.85, 0.30, fl);                        // full in dark/mid, ~0 in highlights
      float flift = (1.0 - smoothstep(0.0, 0.14, fl)) * 0.30;       // near-black lift
      col += (fg + flift) * uGrainAmt * fw;
      // vignette
      vec2 q = vUv-0.5;
      float vig = smoothstep(1.10, 0.28, length(q)*1.25);
      col *= mix(0.66, 1.0, vig);
      col = clamp(col,0.0,1.0);
      gl_FragColor = vec4(col,1.0);
    }

// --- nova (fragment) ---

    precision highp float;
    uniform sampler2D tDiffuse;
    uniform float uNova, uNovaDir, uAspect, uPeak, uShock, uShockDeg, uShockWide, uShockPersp, uShockRoll, uTime;
    uniform vec2 uCenter;
    varying vec2 vUv;
    #define PI 3.14159265
    // --- value-noise fbm for the turbulent shock gas (cheap, GPU-friendly) ---
    float hashN(vec2 p){ p = fract(p*vec2(127.1,311.7)); p += dot(p, p+34.5); return fract(p.x*p.y); }
    float vnoise(vec2 p){
      vec2 i = floor(p), f = fract(p);
      vec2 u = f*f*(3.0-2.0*f);
      float a = hashN(i), b = hashN(i+vec2(1.0,0.0));
      float c = hashN(i+vec2(0.0,1.0)), dd = hashN(i+vec2(1.0,1.0));
      return mix(mix(a,b,u.x), mix(c,dd,u.x), u.y);
    }
    float fbm(vec2 p){
      float v = 0.0, a = 0.5;
      for(int i=0;i<5;i++){ v += a*vnoise(p); p *= 2.02; a *= 0.5; }
      return v;
    }
    void main(){
      vec3 col = texture2D(tDiffuse, vUv).rgb;
      // EARLY-OUT (uniform branch — coherent across the whole screen): outside the
      // supernova band the envelope is numerically zero (uNova is a stage-space
      // Gaussian; it is < 1e-4 for every stage beyond ~±0.27 of the blast centre,
      // i.e. EVERY settled state) and then BOTH composited terms below are zero:
      //   bleach ≤ uNova·0.28·uPeak < 3e-5   and
      //   gasAmt ≤ 1.3·smoothstep(0,0.16,uNova)·uShock < 2e-6,
      // each far below one 8-bit LSB (1/255 ≈ 3.9e-3) on the canvas this pass
      // writes to — so skipping the ~10 fbm octaves + shock-disk math per pixel is
      // pixel-identical. The pass itself still runs (it is the composer's
      // renderToScreen output), only the wasted per-pixel ALU is dropped; inside
      // the blast band the full path runs unchanged.
      if (uNova >= 1e-4) {
      // distance from the blast origin, aspect-corrected so the front is a
      // circle, not an ellipse on a wide viewport.
      vec2 q = (vUv - uCenter); q.x *= uAspect;
      float d = length(q);
      bool implode = uNovaDir < 0.0;
      // RADIAL FRONT.
      //  explode: the white front expands OUTWARD as the envelope grows — bright
      //    inside the radius (uNova*1.4), soft 0.45 falloff so it reads as light.
      //  implode: the front COLLAPSES INWARD. As the envelope rises the lit region
      //    shrinks from the whole frame down to the center: it's white OUTSIDE a
      //    radius that contracts from far (edges) to 0 (center). Same 0.45 soft
      //    edge, mirrored. This is the un-explosion's gathering shell of light.
      float front = implode
        ? smoothstep((1.0 - uNova) * 1.4, (1.0 - uNova) * 1.4 + 0.45, d)
        : smoothstep(uNova * 1.4, uNova * 1.4 - 0.45, d);
      // Keep the flash radial and cinematic: bright around the origin/front, with
      // the corners protected so the beat never reads as a flat loading whiteout.
      // Tighter edge guard (1.00→0.18) keeps the OUTER frame darker so the blast
      // reads as a glowing ball, not an edge-to-edge wash. A small hot core bloom
      // adds punch at the centre without flooding the screen.
      float edgeGuard = smoothstep(1.00, 0.18, d);
      float coreBloom = smoothstep(0.88, 1.0, uNova) * smoothstep(0.58, 0.0, d) * 0.20;
      // The big FILLED whiteout used to be the whole supernova; now the turbulent gas disk
      // (below) is the headline, so the filled flash is pulled WAY down (×0.28) — it would
      // otherwise wash the disk's interior flat grey. What survives is a restrained warm
      // bloom at the very centre so the detonation still flashes, but the disk reads against
      // dark space, cinematic. coreBloom keeps the tight central punch.
      float bleach = max(uNova * front * edgeGuard * 0.28, coreBloom) * uPeak;
      // ============================ INCLINED SHOCK GAS DISK ============================
      // The blast is a turbulent ring of incandescent gas lying in a flat plane TILTED in 3D
      // toward the camera, so it reads as a real disk receding INTO the frame (Saturn-rings
      // perspective) — NOT a flat squashed oval painted on the glass. We do a true camera
      // RAY → DISK-PLANE intersection: build a view ray for each pixel, intersect it with the
      // tilted plane, and sample the turbulent gas at the 3D hit point. That gives genuine
      // perspective — the NEAR (bottom) half large & spread, the FAR (top) half compressed &
      // converging toward a vanishing line — instead of a top-bottom-symmetric ellipse.
      float ringE = clamp(implode ? (1.0 - uNova) : uNova, 0.0, 1.0);
      float ringR = pow(ringE, 0.6) * 1.05;            // expanding shock radius in DISK-PLANE units
      // blast envelope (0 at rest → 1 mid-blast → 0): gates both the gas and the hot core so
      // the whole disk fades in and out with the supernova instead of sitting there.
      float shockEnv = smoothstep(0.0, 0.16, uNova) * smoothstep(1.0, 0.22, uNova);
      // --- project the screen point onto the tilted disk plane (2D perspective model) ---
      // We want a disk that (a) lies in a flat plane TILTED toward the camera and (b) reads
      // in PERSPECTIVE — the NEAR (bottom) half larger & more open, the FAR (top) half
      // compressed & converging toward a vanishing line up the frame. A symmetric squashed
      // ellipse fails (b); a full ray-plane trace collapses to an invisible sliver at steep
      // tilts. This closed-form perspective map gives both, robustly, and always fills frame.
      //   - horizontal: full-width lateral axis (undo the flash aspect, widen by uShockWide)
      //   - vertical: foreshorten by sin(incl), THEN apply a perspective DIVIDE keyed to the
      //     vertical position so the far (upper) half compresses and the near (lower) half
      //     opens — the asymmetry that makes it read as a 3D plane, not a flat oval.
      float incl   = radians(uShockDeg);               // 0 = edge-on, 90 = face-on
      float vFore  = max(0.10, sin(incl));             // base vertical foreshortening
      // ROLL: rotate the whole disk frame in-plane so its long (lateral) axis sits on a
      // DIAGONAL slant across the frame — like a clock hand — instead of dead horizontal.
      // We rotate the screen point INTO the disk's frame by -roll, build the flat/perspective
      // disk there, and the result is the disk slanted by +roll on screen. uAspect is undone
      // first so the rotation is by a true geometric angle, not skewed by the wide viewport.
      float roll = radians(uShockRoll);
      vec2  qa   = vec2(q.x / uAspect, q.y);           // aspect-true screen offset from centre
      float cr = cos(roll), sr = sin(roll);
      vec2  qr = vec2(qa.x * cr + qa.y * sr, -qa.x * sr + qa.y * cr); // rotate into the disk frame
      float yC     = qr.y;                             // signed depth across the (rolled) disk
      // perspective divide along the disk's depth axis: points on the FAR side push to larger
      // in-plane V (compressed on screen → converging); the NEAR side opens out. uShockPersp
      // sets the convergence strength (0 = flat symmetric ellipse, ~1 = strong 3D tilt).
      float persp  = 1.0 / (1.0 - uShockPersp * clamp(yC * 2.0, -0.9, 0.9));
      float diskX  = qr.x / uShockWide;                // lateral axis (along the rolled long axis)
      float diskY  = (yC / vFore) * persp;             // foreshortened + perspective-warped depth axis
      vec2  dp = vec2(diskX, diskY);                   // position in the disk plane
      float onDisk = 1.0;                              // (2D model: the whole frame maps onto the plane)
      float rDisk = length(dp);                        // radius in the disk plane
      // TURBULENT GAS DENSITY — fbm sampled in disk-plane CARTESIAN coords (NOT polar), so
      // the clumps are isotropic with NO central pinwheel/spoke artifact and no atan branch
      // seam. We advect the clouds OUTWARD by pulling the sample point inward along its own
      // radial direction over time (dp - dir*flow), so the gas appears to stream out of the
      // core along the shock. Two octave sets: coarse billows + fine filaments.
      float flow = uTime * 0.16;
      vec2  rdir = dp / max(rDisk, 1e-3);
      float billow = fbm(dp * 3.0 - rdir * flow);
      float fine   = fbm(dp * 8.5 + vec2(11.0, 4.0) - rdir * flow * 1.6);
      float gas = mix(billow, fine, 0.45);             // 0..1 turbulent density field
      // CONTRAST the density for a CINEMATIC read: gamma it up so the clumps separate into
      // bright filaments and deep dark lanes (a soft uniform field reads as cheap haze). The
      // remap pushes the low end toward black and keeps the peaks, so the gas has structure.
      gas = pow(clamp(gas, 0.0, 1.0), 1.7);
      // RADIAL SHELL: the gas lives in a band around the expanding shock radius — a wide
      // INNER fill (already-shocked gas glowing behind the front) plus a tight bright CREST
      // at the front. The turbulence erodes the band edges so the rim is ragged, not a wire.
      // Bands narrowed + inner fill cut so the disk is a defined RING with dark space around
      // it, not a frame-filling glow.
      float band  = smoothstep(0.42, 0.0, abs(rDisk - ringR));     // broad shell (tighter)
      float crest = smoothstep(0.12, 0.0, abs(rDisk - ringR));     // bright leading rim
      float inner = smoothstep(ringR + 0.0, ringR - 0.32, rDisk);  // fill trailing the crest, toward core
      float shell = max(crest * 0.85, max(band * (0.20 + 0.80 * gas), inner * 0.35 * gas));
      // clouds: modulate the whole shell by the gas so it breaks into clumps + dark lanes.
      // Lower floor (0.18) = the gaps go properly dark, the structure reads as volume.
      shell *= (0.18 + 0.95 * gas);
      // VOLUME / limb-brightening: thicken the RIM gas near the disk's top & bottom edges
      // (where, seen at this shallow tilt, we look through more gas) so it reads as a fat
      // torus. Gated to the rim band (rDisk near ringR) so it ONLY shapes the gas ring and
      // never touches the core — otherwise abs(diskY)/rDisk blowing up near the centre
      // carved a bow-tie into the hot heart. The rims are where |diskY| ≈ rDisk.
      float rimBand = smoothstep(0.45, 0.12, abs(rDisk - ringR)); // 1 on the ring, 0 at centre
      float limb = smoothstep(0.82, 1.0, abs(diskY) / max(rDisk, 1e-3)) * rimBand;
      shell *= (1.0 + 0.35 * limb);                    // gentler so it never carves a dark mid-lane
      // SHADOW GAP: a SOFT, shallow moat just inside the ring so the hot heart reads as
      // separated from the gas — depth, not a flat blob. Kept soft + shallow (×0.30, wide
      // smoothstep) because on this strongly-inclined disk the gap projects to a thin
      // horizontal lane, and a hard version read as an ugly dark SEAM across the middle.
      float gapZone = smoothstep(0.40, 0.16, rDisk) * smoothstep(0.02, 0.16, rDisk);
      shell *= (1.0 - 0.30 * gapZone);
      // HOT CORE: a tight, round, hot heart at the disk centre (the detonating star), so the
      // middle reads as searing light the gas streams out of — not flat textured cloud. Added
      // AFTER the limb shaping so the rim's vertical-axis weighting can't carve it into an
      // hourglass. DIMMED + tightened (0.30 radius, ×0.7) so it's a controlled bright point,
      // not a blown-out wash.
      float core = smoothstep(0.30, 0.0, rDisk) * shockEnv;
      shell = max(shell, core * 0.7);
      // reach guard (in disk-plane radius). Pulled IN so the outer gas falls to black sooner —
      // darker, moodier frame, no haze to the edges. onDisk masks the half-frame where the
      // view ray escapes ABOVE the tilted plane's horizon (no disk there → true perspective,
      // the far side fades into space). Soften the horizon so it isn't a hard cut.
      float reach     = smoothstep(1.5, 0.10, rDisk);
      float gasAmt    = clamp(shell, 0.0, 1.3) * shockEnv * reach * uShock * onDisk;
      // FIERY PALETTE (mirrors the reference): deep maroon/rust at the cool outer rim →
      // burnt orange → hot amber → blazing magenta-white at the inner/hottest edge. Mapped
      // by where we are across the shell (hot toward the shock radius / core, cool outward).
      float heat = clamp(1.0 - (rDisk - (ringR - 0.30)) / 0.9, 0.0, 1.0); // 1 hot (inner) → 0 cool (outer)
      heat = clamp(heat + 0.25 * (gas - 0.5), 0.0, 1.0);                  // turbulence mottles the temperature
      // Cool end pushed toward a DARK ember-red (not grey) so low-density gas reads as
      // embers fading to black, never a muddy grey haze. Warm mids kept saturated.
      vec3 cMaroon = vec3(0.20, 0.025, 0.03);  // #340708 near-black ember red (dark outer/low-density)
      vec3 cRust   = vec3(0.80, 0.20, 0.09);   // #CC3317 burnt orange
      vec3 cAmber  = vec3(1.0,  0.56, 0.22);   // #FF8F38 hot amber
      vec3 cMagma  = vec3(1.0,  0.50, 0.62);   // #FF809E hot rose core — saturated, not washed pink-grey
      vec3 gasCol = mix(cMaroon, cRust, smoothstep(0.0, 0.30, heat));
      gasCol = mix(gasCol, cAmber, smoothstep(0.30, 0.66, heat));
      gasCol = mix(gasCol, cMagma, smoothstep(0.66, 1.0, heat));
      // keep the interior saturated: pull any grey back toward the warm hue, so the fill
      // reads as glowing gas, not desaturated smoke.
      float lum = dot(gasCol, vec3(0.299, 0.587, 0.114));
      gasCol = mix(vec3(lum), gasCol, 1.25);   // >1 = boost saturation
      gasCol = max(gasCol, vec3(0.0));
      // composite the COLORED gas additively over the graded frame (gas EMITS light), capped
      // by uPeak so the hottest clumps stay just under pure white like the rest of the scene.
      // Gain dimmed (1.4 → 0.90) so the disk glows like deep incandescent matter, not a
      // blown-out light — the brief asks for less glow / more cinematic mood.
      col += gasCol * gasAmt * uPeak * 0.90;
      // TEMPERATURE.
      //  explode: blue-white when hot (high uNova) → warm amber as it cools.
      //  implode: time-reversed — gathers cool/amber, SNAPS blue-white at the peak
      //    (light arriving), the exact mirror of the explode cooldown. Achieved by
      //    reading the ramp on the rising envelope the same way; the perceptual
      //    reversal comes from the inward-collapsing front above carrying it.
      // Warmer overall so the supernova reads as incandescent stellar matter, not
      // a cold grey/white screen wipe. The peak is a warm white-gold; it never goes
      // fully blue-white. The cast is stronger (0.42 white mix vs 0.6) so the warm
      // temperature survives the bleach instead of washing to neutral grey.
      // PALETTE (supernova): white-hot center → amber edge → burnt-orange shadows.
      // The hot peak stays a warm white; the cooling trailing edge is pushed toward a
      // clear BURNT ORANGE (green 0.82 → 0.74, blue 0.55 → 0.40) so the flash cools
      // into the same burnt-orange shadow family the debris ramp carries.
      // ITEM 3 collapse palette: warm-white front #F3EFE2 -> hot amber edge #FF9A2E.
      vec3 cold = vec3(0.953, 0.937, 0.886); // #F3EFE2 warm-white shock front
      vec3 warm = vec3(1.0, 0.604, 0.180);   // #FF9A2E hot amber cooling edge
      vec3 tint = mix(warm, cold, smoothstep(0.35, 0.90, uNova));
      vec3 white = mix(vec3(1.0), tint, 0.42); // warm-tinted, never neutral white
      col = mix(col, white, clamp(bleach, 0.0, 1.0));
      } // end of the uNova early-out branch (see the top of main)
      gl_FragColor = vec4(col, 1.0);
    }
tesseract
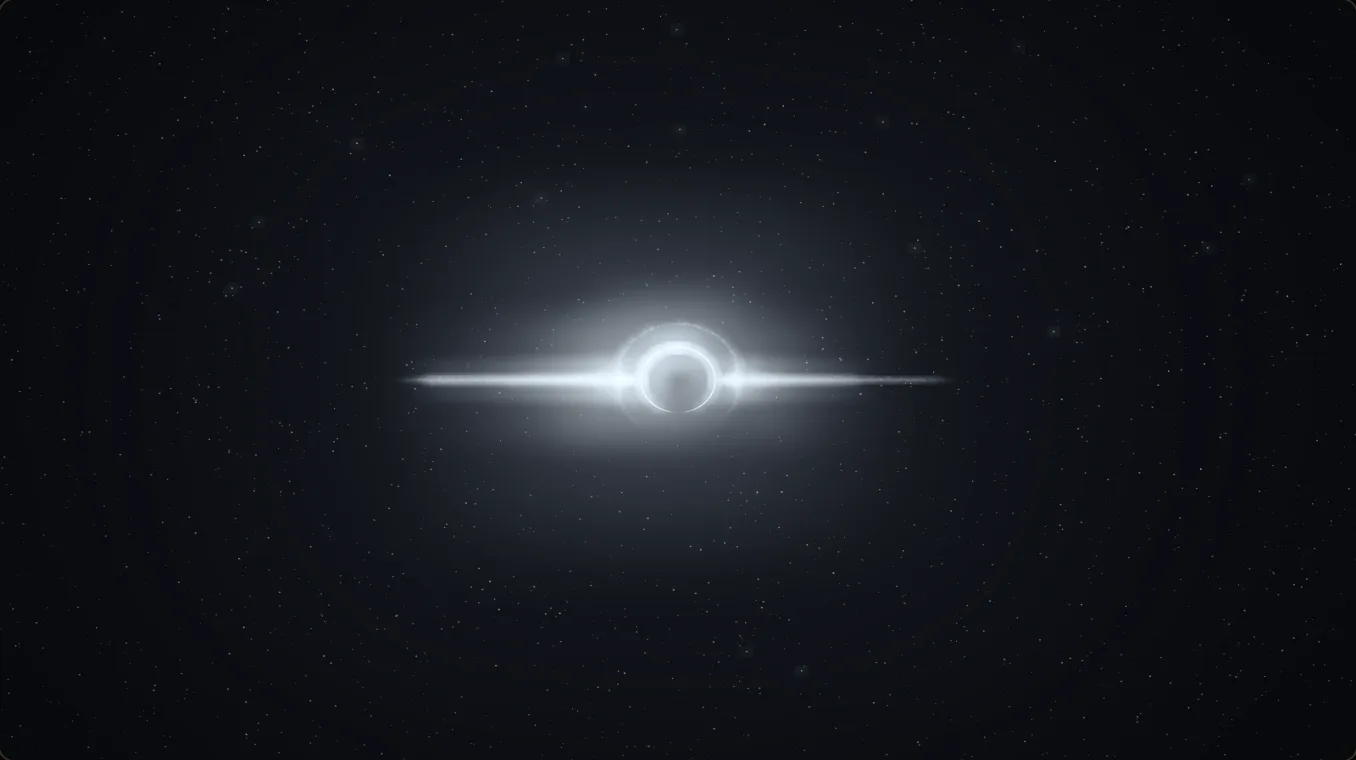
Not a raymarch — a single InstancedMesh of unit boxes shaded as long shelf beams in a nested-frame bookcase tunnel. Used as the alternate article backdrop.
View GLSL — first 90 of 199 lines
Full source (199 lines) on GitHub
  precision highp float;

  uniform float uTime;
  uniform float uDim;        // master exposure (keep dim so the reading text stays legible)
  uniform float uCore;       // core-light lambert strength down the tunnel
  uniform float uFogDensity; // exponential depth haze toward the core
  uniform vec3  uCoreColor;  // warm vanishing-point glow colour
  uniform vec3  uFogColor;   // colour the far beams wash toward (the luminous core)
  uniform float uEdgeLeak;   // edge-seam emissive strength (light between shelves)
  uniform float uStreakAmt;  // along-length streak ripple strength

  varying vec3 vWorldNormal;
  varying vec3 vViewPos;
  varying vec3 vColor;
  varying float vLong;
  varying float vAcross;
  varying float vHue;
  varying float vStreak;
  varying float vDepth;
  varying float vFaceLong;

  float hash11(float p) {
    p = fract(p * 0.1031);
    p *= p + 33.33;
    p *= p + p;
    return fract(p);
  }

  void main() {
    vec3 N = normalize(vWorldNormal);
    vec3 V = normalize(-vViewPos);            // toward the camera (view space, cam at 0)

    // core light: the bright vanishing point is the ONLY source. Faces turned toward it
    // (end caps, inner faces) catch a warm key; faces perpendicular to it (the long wall
    // faces) fall to a near-black fill. Wrap a touch so the shadow side isn't dead flat.
    // FILL LOWERED (0.05+0.07 → 0.028+0.045): the old ambient held every face at a
    // readable mid-brown, which is exactly what made the walls read as flat untextured
    // boxes ("PS1"). The film's tesseract is mostly BLACK shelf-backs punctuated by hot
    // light slits — so the darks must actually fall to near-black.
    vec3 coreDir = normalize(vec3(0.0, 0.0, -1.0));
    float nl = dot(N, coreDir);
    float lambert = max(nl, 0.0);
    float wrap = max(nl * 0.5 + 0.5, 0.0);    // soft wrap term for the shadow side
    float fill = 0.028 + 0.045 * wrap;        // most faces sit in true shadow
    float lit = fill + uCore * lambert;

    // tight view-facing sheen so steel beams catch a thin rim of light
    float sheen = pow(max(dot(N, V), 0.0), 5.0) * 0.07;

    // base colour with a small per-beam warm/cool push (wood ↔ steel/graphite)
    vec3 base = vColor;
    base = mix(base, base * vec3(1.12, 1.02, 0.86), max(0.0, -vHue)); // warmer (wood)
    base = mix(base, base * vec3(0.88, 0.95, 1.10), max(0.0,  vHue)); // cooler (steel)

    vec3 col = base * lit + sheen;

    // per-face BOARD texture — thin parallel slats across the beam's short section plus
    // a coarse value grain along its length, so a face that lands big on screen shows
    // shelf boards instead of one flat untextured quad (the single biggest "PS1" tell).
    float slat = sin(vAcross * 30.0 + vHue * 57.0) * 0.5 + 0.5;
    float grain = hash11(floor(vLong * 24.0) + vHue * 91.0);
    col *= mix(0.78, 1.08, slat) * mix(0.88, 1.12, grain);

    // along-length MOTION SMEAR: the film beams are blurred into long bright/dark streaks
    // down their length. Use mostly LOW-frequency runs (long smears) with a little fine
    // grain on top, plus a velocity gradient that brightens one end (the leading smear),
    // so each beam reads as a streak, not a flickery box.
    float freq = mix(7.0, 16.0, vStreak);                 // LONG runs → smear, not flicker
    float r1 = sin(vLong * freq + vHue * 31.0) * 0.5 + 0.5;
    float r2 = sin(vLong * freq * 3.1 + vHue * 13.0) * 0.5 + 0.5; // fine grain on top
    float grad = vLong * 0.5 + 0.5;                       // leading-end velocity smear
    float ripple = r1 * 0.55 + r2 * 0.2 + grad * 0.25;
    ripple = mix(0.5, ripple, uStreakAmt * (0.5 + 0.5 * vStreak));
    float band = smoothstep(0.78, 0.84, hash11(vHue * 53.0 + 3.0)) *
                 (sin(vLong * 5.0 + vHue * 11.0) * 0.5 + 0.5);
    col *= (0.22 + 0.98 * ripple);           // deep troughs → strong streak contrast
    // a SUBSET of beams carry a hot warm light-streak (light leaking between shelves) —
    // sparse but bright, so the dark walls are punctuated by glints like the film. A slow
    // per-beam FLICKER rides on it (uTime) so the slits read as live leaking light, not
    // baked-on paint.
    float flick = 0.85 + 0.15 * sin(uTime * 1.6 + vHue * 40.0);
    col += band * 1.35 * uCoreColor * (0.5 + 0.5 * ripple) * flick;
    col *= mix(1.0, 0.6, smoothstep(0.55, 1.0, vLong) * vStreak);

    // edge leak: bright thin rim along the long top/bottom seams (between shelves),
    // strongest on beams turned toward the camera so it reads as a caught highlight.
    // This is the film's signature cue (light pouring between shelf backs), so it now
    // leads the image: hotter than before and slightly warmer than the base wood.
    float seam = smoothstep(0.62, 0.98, vAcross) * vFaceLong;
Performance budgets
Budgets the site is built against, with the measured value next to each.
Nothing in this table is typed by hand: CI enforces the same numbers
(scripts/check-bundle-budgets.mjs), and a build whose output
drifts from what this page claims fails
(gen-perf-report.mjs --check, ±5%).
Generated 2026-07-12 at 4d01efb by
scripts/gen-perf-report.mjs — regenerated per release, not
hand-written.
| Metric | Budget | Last measured | Note |
|---|---|---|---|
| Hero engine graph JS (gz) | ≤ 240 KiB (target 235) | 231.4 KiB | three-core + three-post + the createScene chunk + the warmThree facade; dynamically imported, so it never blocks first paint. |
| Home pre-engine JS (gz) | ≤ 100 KiB (target 96) | 93.4 KiB | Everything / requests before the engine import fires: island runtime, hero shell, HUD nav, loader controls. |
| Reading-route JS (gz, worst route) | ≤ 40 KiB (target 20) | 15.6 KiB | Reading routes ship zero three.js (e2e-asserted); this caps everything else they load. |
| HTML per page (gz, worst page) | ≤ 90 KiB (target 56) | 52.8 KiB | Stylesheets are inlined, so this one number also caps CSS growth — grain data-URIs included. |
| Largest shipped raster | ≤ 500 KiB (target 250) | 197 KiB (of 56) | Every content raster goes through astro:assets; the CI gate has no grandfather list. |
| CLS (lab, worst route) | ≤ 0.02 (CI error) | 0.001 | Lighthouse 2026-07-11, 5 routes (local runner). Fixed-footprint canvas host + dimensioned images. |
| LCP (lab, home) | ≤ 2.0 s (CI warn) | 1.55 s | Lighthouse 2026-07-11, throttled mobile profile on a software-rendered local runner — an upper bound: the loader paints as server HTML before any engine byte arrives. |
Field Core Web Vitals (real-visitor INP, LCP, CLS) are deliberately absent:
they need RUM, which this site does not run yet — the wiring is documented
and waiting rather than the numbers being guessed. Main-thread lab time
(TBT) is also collected per release but not tabled: the available runners
render WebGL in software, so that number describes the runner, not the
site — it lives in perf-report.json and gates as a CI warning
until real rendering hardware joins the pipeline.
And what your machine is doing right now — independent of the engine, just the browser's own rAF clock:
Fallback ladder
The same beat at four capability levels. The article only ever loses the backdrop in the bottom two rows — the prose, the HUD, and the chrome stay unchanged. None of these rows depend on the live engine to render: each is a static card describing what the system would do.
-
High tier
The full ~1.2M-point cloud, post chain on, native DPR clamp.
What you are reading this paragraph through — the engine running unhindered.
-
Low tier
16k–24k points, no bloom, DPR 0.6×, capped at ~30 fps.
Any mobile / weak GPU / ≤ 4 cores / ≤ 4 GB / no WebGL2 demotes here automatically.
-
Reduced motion
No live engine; CSS-painted poster of the same beat.
Respects the reduced-motion preference. The article prose is unchanged — only the backdrop swaps.
-
No WebGL
A flat dark room with the same dim wash CSS already provides.
A typed WebGLUnavailableError is caught at mount; the article stays fully readable.
Design decisions
Why DPR is clamped. The cloud is fragment-bound. Doubling
DPR quadruples the work the fragment shader does without changing what the
eye reads. tuneRenderPixelRatio caps the ratio at 1.85× on
capable laptops and 0.6× on low-tier devices, and the browser upscales.
Why the low tier caps at ~30 fps. A mobile GPU under CPU throttle cannot hold 60 fps with the cloud lit. Targeting 30 fps lets the engine spend its frame budget on getting each frame correct instead of thrashing toward a number it could never reach.
Why text is server-rendered. Astro renders every paragraph on this page to HTML at build time. With JavaScript disabled the page is still complete: the article reads top to bottom, the headings still anchor, the GLSL excerpts are still inspectable. The engine is an enhancement, not a prerequisite.
Why shaders compile behind the dive veil. A fresh WebGL program can take 50–200 ms to link on first use; the engine triggers that compile while the page is already under a white plunge overlay, so the cost lands in a frame the visitor cannot see.
Source for everything on this page lives at github.com/ilies-bel.